Having made online statistical mapping tool Local Insights freely available in April, we have now updated the data sets and area reports. The latest data is showing the economic impacts of COVID-19 locally.
Local Insights, developed by Oxford Consultants for Social Inclusion (OCSI) a spin-out from the University of Oxford Social Policy Institute, collects all local and open data published by more than 50 government agencies. It brings in hundreds of data sources that give objective information about deprivation, health, education, housing, employment, crime and much more.
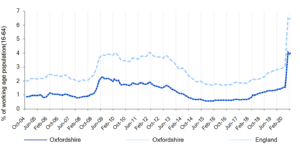
Unemployment benefit claim data between March 2020 and May 2020, shows the numbers in Oxfordshire increased by 10,845 or 163%. This was above each of the increases across England (+114%) and the South East (+150%). The long-term trend is showing a much sharper increase than in 2008/09.
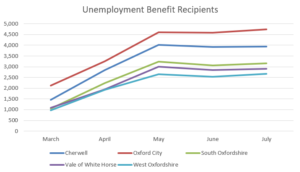
This data, at district council level, shows that unemployment rose sharply in April and May and has stabilised at these high rates through June and July.
OCF will soon publish a more detailed unemployment and economic impact insight, highlighting wards where claimants are high or the proportion of unemployed exceeds the national average.
Access to such insight, through the OCF website, can be used to look at the data right down to neighbourhood level through interactive maps. A wide selection of full profile insight reports is already available at district council, ward, town, and parliamentary constituency level. OCF can add reports for any area in Oxfordshire – aggregating data for a selection of neighbourhoods, which are then set against comparison charts and tables for Oxfordshire and England. Please contact us to request a new area to be added.
These Local Insight reports were used to highlight some of the economic and social differences across Oxfordshire presented in our recent Zoom webinars. OCF produced Needs Analysis Summaries, of these larger Local Insight reports, highlighting, mapping, and giving commentary on key statistics and indices relevant to the area, such as age of population, Covid vulnerable groups, community needs, education, and isolation levels.


